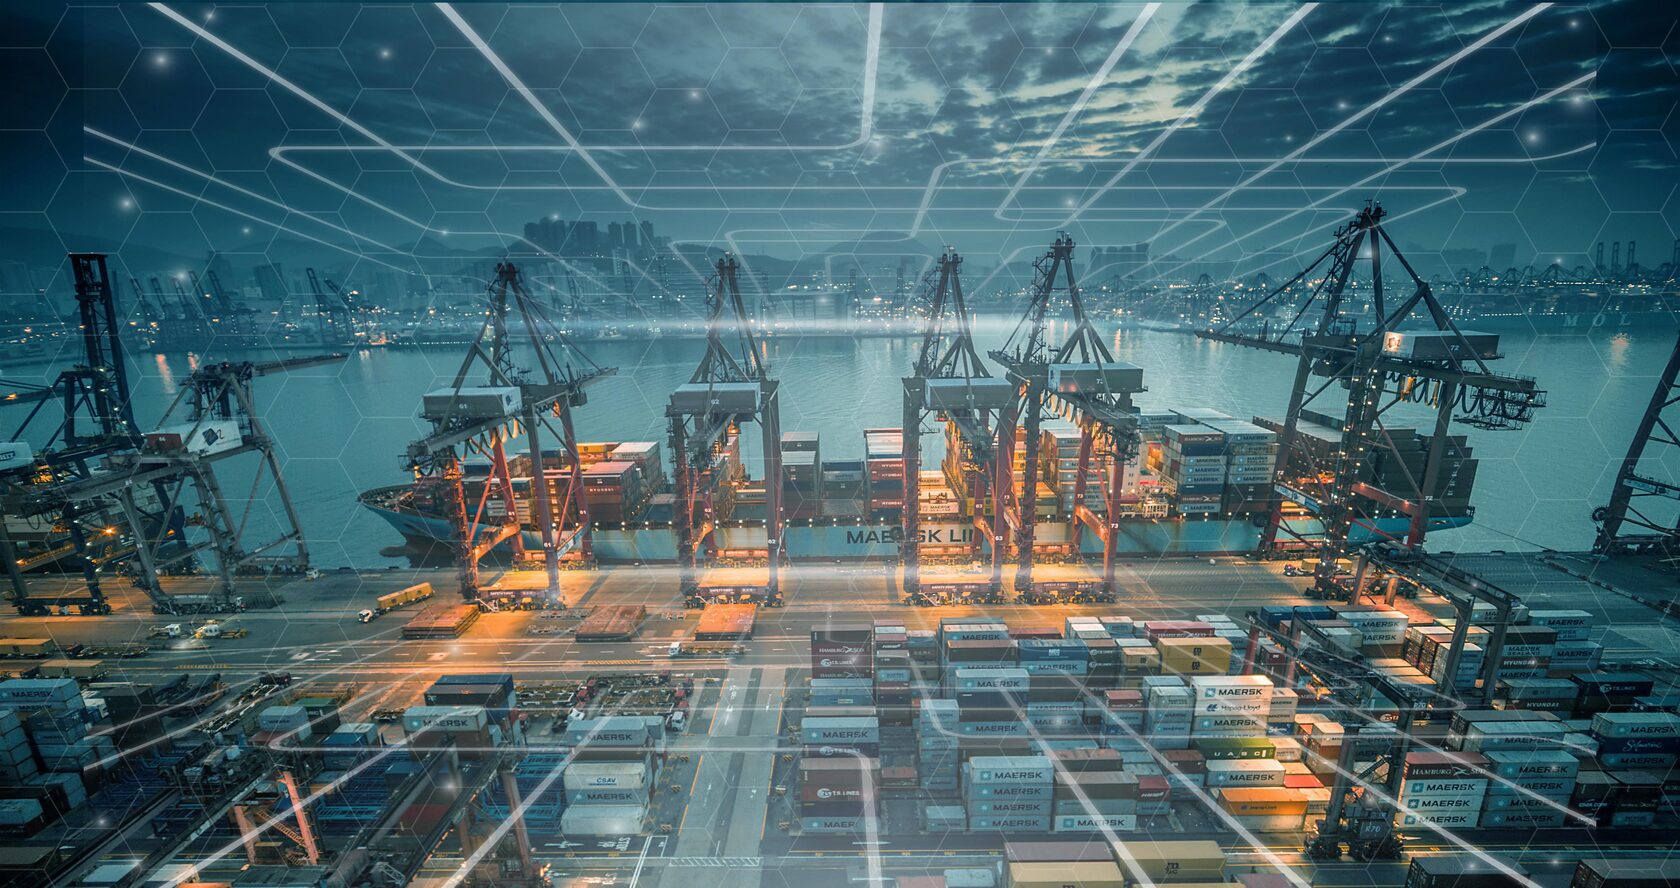
SMART SEAPORT
The Digital Twin of Seaport

Get more about Smarttwin system
SMART SEAPORT
The Digital Twin of Seaport
Get more about Smarttwin system
WHAT IS SMATTWIN ?
HOW TO REDUCE THE COST OF OPERATIONS AND IMPROVE EFFICIENCY ?
The Seaport has a lot of areas to store containers, bulk, Ro-Ro cargo
But how to find the right spot for cargo placement considering predefined limits for available storage, history of dwell time for every container, forecasted cargo arrival time, etc.?
Seaport is working with different transportation companies
But how to synchronize cargo operations with cargo delivery to\or from a terminal by trucks or railway?
Ships arrive every day
How to choose the right berth for each ship considering the type of cargo, assets availability for the cargo operations, storage capacity, vessel schedule, cost of operation and assigned laytime?
There are a lot of SMART management systems in the Seaport
Many details but how to see the whole picture?
SMARTTWIN SYSTEM
HOW IT WORKS
Always represent an existing operational object – from design proposal to system handover, the digital twin will reflect a real object
Represent the object's real-world state – provide data that describes the present and historical conditions of the object and external and internal processes
Models can expand into multiple realms: supply chain analysis can benefit from modelling warehouse operations, truck management system and weather conditions
SYSTEM DESIGN
SMARTTWIN FEATURES
3D/2D model of the Seaport
User-friendly interface
Artificial Intelligence and Simulation Modeling
User-friendly interface
Artificial Intelligence and Simulation Modeling
WHY 3D
User friendly interface with natural view on virtual environment
User can observe on any object on the screen from different distance and angle
Zoom and rotation in 3 dimensions help to see everything from the best angle and distance without going on site
User can observe on any object on the screen from different distance and angle
Zoom and rotation in 3 dimensions help to see everything from the best angle and distance without going on site
USER FRIENDLY INTERFACE
The data collected from sub-systems is representing in Realistic 3D view
Real-time updates and reliable information
Direct access to any device or object at the Seaport
Monitoring and control on machinery
Different user profile settings
Objects and cargo search
Technological processes visualization
Visual planning of cargo placement in the storage zone
Real-time updates and reliable information
Direct access to any device or object at the Seaport
Monitoring and control on machinery
Different user profile settings
Objects and cargo search
Technological processes visualization
Visual planning of cargo placement in the storage zone
SmartTwin "rewind" feature
The REWIND feature allows:
- To restore the stage of all data systems in the Terminal (TOS, ERP, IoT Platforms, Fleet management, etc.) on any date in the past
- To show what was happening in the Terminal on any day in the past (operations, trucks and crane movements, cargo location, vessels, etc.)
- All data from different sources is consistent and time-stamped
- The data could be used for analysis, operation optimization, and anomalies detection
WHERE IS AI ?
The module uses self-learning AI algorithms, which are improving cargo operations, reducing the cost of them and collecting data for further analysis and operations optimization
WHERE IS AI ?
The module uses self-learning AI algorithms, which are improving cargo operations, reducing the cost of them and collecting data for further analysis and operations optimization

AI helps to detect and prevent accidents on the yard.

AI modules are working in the background and analyze Big Data coming from different sources.

AI helps in decision making for different user roles.

AI optimizes the cranes and truck management, berth allocation for vessels, cargo storage, container placement, manpower allocation, vessels movements, bunkering services, etc.

AI reduces the cost of operations and improves the time.
Simulation Modeling
The simulation model could be used for modeling of port operation including ships, internal and external trucks, berths, yard, warehouses, transit yard, ro-ro berths, cranes, forklifts, etc. in statistical-mathematical terms

Key benefits of the simulation modelling:
- statistics on cargo flows
- utilization of berths and equipment
- productivity indexes
- answer on "what if…" question
- helps in forecasting and planning resources
- improves productivity, machinery utilization, throughputs, eliminates bottlenecks in processes, reduce development and construction cost
BENEFITS OF SMARTTWIN
Digital Twin concept represents the convergence of the physical and the virtual world where every industrial product, operational process or asset will get a dynamic digital representation
Fast ROI for SmartTwin Deployment
Revenue Growth
Reduction of Operating Cost
Single high-level platform fulfilled with Big Data
3D visualization of assets and operations
Prediction of emergencies, testing reaction
AI for operation optimization
Simulation of processes, services and asset locations
Reducing human errors and improving productivity
Smart enterprise platform for real-time onsite or remote management
End-to-end integration with existing management systems
Saving on the cost of cargo moves, equipment maintenance, fuel consumption, time for the operation, rent cost, etc.
Improving terminal cargo throughput, berths usage, asset management, reducing dwell time for containers on the yard
USE CASES
HOW WE PROCESS THE DATA
9
years of research and development
4
seas
1 M+
real-time monitored objects
CONTACTS
INTELLECTIKA LLC
RUSSIA - MOSCOW
+ 7 (495) 215-11-80
UAE - DUBAI
+971 55 161 8657
port@ismarttwin.com
RUSSIA - MOSCOW
+ 7 (495) 215-11-80
UAE - DUBAI
+971 55 161 8657
port@ismarttwin.com